GPS-related research in Team Sport – Are we done or is there new windows of opportunity ?

My thought in this post will be relatively straightforward: I believe that over the last 15-years we have researched and covered most of what we can about external training load; it’s time to move forward and find our new window of opportunity to get a real impact on the field.
There is more than 1200 published articles dealing with external load monitoring (1) and we are still publishing about 150 per year. If we refer to the Pareto law [2] - saying that 80% of achievement is done with 20% of time (and vice-versa), it seems that we are now entered the 80% of effort for 20% of results and a very small window of opportunity left in terms of impact on the field.

Since the early 2000s there has been an exponential rise in research about training load monitoring [3-6], reinforcing sports scientists’ evidence-based analyses. A recent survey on the current practices of high-level football clubs to monitor training load showed that of 41 clubs surveyed, 40 collected heart rate and GPS data for every player during every field training session [7]. This is even more evident today with almost all professional teams (first and second division... even below!) buying GPS system to collect external load data.
However, we sometimes loose in mind that the assessment of the various training aspects needs to help us to infer on the athletes' dose-response relationships to training. To do so, practitioners collect training load data and sometimes, the response to the load. To align on the topic, let me quote Impellizzeri et al. [8] "The training load in the context of athletic training has been described as the input variable that is manipulated to elicit the desired training response. Training load can be described as being either external and/or internal, depending if we are referring to measurable aspects occurring internally or externally to the athlete." (Figure 2)

But, here are the current issues:
EXTERNAL load. While GPS are mainly used to measure distances covered at various speed (i.e. see Akenhead paper [7] to see which are the most commonly used metrics in football), we know few things about mechanical constraints induced by high acceleration or deceleration, changes of directions, and so on.
INTERNAL load:
We collect Heart rate measurement (HR)
Health, sleep, nutrition, environment, genetics... are almost never used in the models (see Figure)
RESPONSES to the load or Training OUTCOMES in our figure.
For training outcomes, we try to use on a weekly or post-game basis some jumping variations, subjective questionnaires, specific lower-body strength measures (adductors, posterior chain…). We talked about that in detail in this paper [9], highlighting that "Monitoring can indeed be invasive, expensive, time inefficient, and difficult to perform routinely and simultaneously in a large squad of regularly competing players. Uncertainty also exists regarding the meaningfulness and interpretation of changes in fatigue response values and their functional relevance, and practical applicability in the field.".
Finally, with these data available, we are trying to increase the power and complexity of our analysis, using more advanced methodology such as machine learning, unsupervised learning, or other random-forest and xGboost [10] (Figure 3) ... Yet, our new quest should be to improve the features of these models (e.g. the variable we put in entry) with variables that could be more closely linked to potential physiological and/or neuromuscular changes directly related to player’s status, isn't it?

Fig: Schematic representation of the training load management process – A. the main focus is to collect external load and sometimes collect response to load with the use of CMJ, Groin squeeze test and wellbeing questionnaire on a weekly basis. In this case, most of the time, practitionners try to develop more robust and complex model to infer on relationships between training load and players’ performance. This can’t be fully satisfying. B. In that case, more research emphasis is put to develop new metrics easily implementable to estimate the response to the load, so we can have more frequent data-point from daily trainings and games. Then, time-series models with more complete dataset can (likely) provide better insights.
So, did we go as far as we can in term of our use of GPS? Are there any other windows of opportunity? Thankfully for researchers (and practitioners & tech providers!), embedded-micro-technologies in GPS offer way more possibilities than just only monitoring external load. I will try to discuss some of them is this blog post.
Understanding overall fitness response to load using external / internal ratios: A first step into the invisible monitoring concept?
To overcome the limitations inherent to the use of external load variables in isolation [28], examining the dose-response relationship between work load and immediate physiological responses (or more simply generic models of work efficiency, i.e., output/cost relationships) may represent the first advances to assess training status from data collected routinely in elite players. The easiest way to do this is to assess the ratio between external load (the output) and the internal load (e.g. HR data or RPE, the cost). Few researchers delved into this topic recently (see Delaney, Buchheit, Akubat or Suaress-Aroness work on this topic; all reference are in this paper [11]).
We find interesting (initial) results when we used multivariate models to predict HR responses to specific training drills from various GPS variables (TD, HSR, MechW ...) [11]. We used individual stepwise regression analysis to identify which combinations of GPS variables showed the largest correlations with HR responses at the individual level and we further used this to predict HR during individual drills. HR predicted was then compared with actual HR to compute an index of fitness or readiness to perform (HRΔ,%). The more HRΔ is high – meaning that the HR predicted is below actual/measured HR - the less fit you are in theory (and vice-versa) (Figure 4).
We managed to reproduce to same results using academy (U19 and U17) data (this is cool) but our models are still struggling to detect in-season changes in fitness. There are two potential explanations (1) changes in fitness during the season are not meaningful or worthwhile, and that's why it is hard to detect them except during pre-season or RTP phases; (2) our models are too noisy, and we need to improve them using more advanced methods.
I think the answer lies somewhere in-between these two options.
As researcher and practitioner, I believe there is value to find in the area if we want to delve into it. That would need more frequent fitness assessment - for this, 4-min runs [12] could be a solution; better mathematical models to handle the non-linear effects and remove the noise; likely cross-club collaboration agreement [13] to improve sample sizes to then, re-use models at an individual model.
I think that there is still some room for classic, non-integrated assessment of fitness in elite players. However, I also believe that there is little value in once 1-a-year physiological assessment – such as treadmill testing done pre-season but not done anymore in-season - to help us improve the way we train elite athletes and adapt training contents on a weekly / daily basis. If we are able to find new way to monitor fitness changes on a more regular basis, we should be able to get more insights into the dose-response relationships and fine tuning training accordingly.
![Figure 4 : Changes in Mechanical Work (a.u, upper panel), HRΔ and HRRUN (lower panel) during pre-season and early in season in one representative elite soccer player. Upper panel: grey bar: training session; black bar: match. 492Lower panel: Red point:75% of substantial increase in HRΔ and HRRUN. Blue point:75% of substantial decrease in HRΔ and HRRUN. Grey point: unclear changes in HRΔ and HRRUN. Grey area stands for trivial changes. Each data point is provided with its typical error (when multiple small-sided games values were combined, the data points represent the mean and the typical error is adjusted for the number of measures (see methods). [From 11]](https://images.squarespace-cdn.com/content/v1/60aba255de98fd0f5a5192b3/1622576158987-BGU5FABGZQ25WH18JV7E/gpsresearch-pic4.png)
Figure 4 : Changes in Mechanical Work (a.u, upper panel), HRΔ and HRRUN (lower panel) during pre-season and early in season in one representative elite soccer player.
Upper panel: grey bar: training session; black bar: match. 492
Lower panel: Red point:75% of substantial increase in HRΔ and HRRUN. Blue point:75% of substantial decrease in HRΔ and HRRUN. Grey point: unclear changes in HRΔ and HRRUN. Grey area stands for trivial changes. Each data point is provided with its typical error (when multiple small-sided games values were combined, the data points represent the mean and the typical error is adjusted for the number of measures (see methods). [From 11]
Understanding neuromuscular response to load using standardized running (e.g. box to box).
As fatigue has been shown to impair leg stiffness [14] and in turn, running mechanics, it was hypothesized that such fatigue-related impairments [15] may be reflected by change in the accelerometer activity (with the greater the reduction of the contribution of the vertical accelerometer vector to the overall magnitude vector, the greater the potential impairment in leg stiffness). Consequently, the use of standardized runs has been suggested to have a better relevance, as in this scenario, external load can be controlled (i.e. speed and running distance) and the changes in the accelerometer (e.g. vertical force load) might be interpreted as a change in neuromuscular status [16]. So how simple it is? Basically, the protocol consists of running 4-6 box-to-box (~70-80m) at a standardized speed of 18-21 km.h-1 (depending of your players, sports and protocol).
![In the figure 5, we can see a GPS trace and the method used to analyze data during standardized runs. The blue line and the associated shaded area represent the portion of the run used for analysis while the Orange one represents the acceleration signal during the run. The protocol is best described in the recent papers published by Cedric Leduc [16,17]. Results obtained after the processing of the data are reliable (~10% CV) and sensitive to high workloads, either acute (e.g. training session [18]) or chronic (weekly pre-season load [17] or training camp [19].](https://images.squarespace-cdn.com/content/v1/60aba255de98fd0f5a5192b3/1622576518303-V0WJBZNQ3U4H6UYSAM8K/gpsresearch-pic5.png)
In the figure 5, we can see a GPS trace and the method used to analyze data during standardized runs. The blue line and the associated shaded area represent the portion of the run used for analysis while the Orange one represents the acceleration signal during the run. The protocol is best described in the recent papers published by Cedric Leduc [16,17]. Results obtained after the processing of the data are reliable (~10% CV) and sensitive to high workloads, either acute (e.g. training session [18]) or chronic (weekly pre-season load [17] or training camp [19].
This offers great possibilities :
We can reduce time-burden for gym monitoring and let players focused during their program.
We can introduce this test as part of the warm-up, nothing is maximal and players run at the same pace, altogether - no pacing, no sheeting.
Thanks to the two above-mentioned points, we can increase the frequency of testing (weekly, every D+2...) and collect more "response-to-load" data in a time-efficient manner.
While this is the beginning of the research (as far as I know) on the use of accelerometer embedded within micro-technologies in team sport (excepting the use of PlayerLoad as a matter of external load variable), and more specifically their applications within an ecological context. I'm convinced that we have a lot more to discover. Are we able to measure reliably contact time and flight time to infer players/leg stiffness? Is there anything to look around step pattern variability [20]? Will we be able to gain more insights into players response to load from theses variables? The next 3-5 years of research on that topic could open new way to monitor on a daily basis elite athlete, and then how we adapt, using evidence-based approach, our training.
Measuring adaptation in horizontal strength and maximal speed in football players using on-field force-velocity profile.
It is an understatement to say that neuromuscular qualities (i.e. strength and speed) are important for soccer players. Today, for most of the players on the field (of course, tactical / technical genius is the first key to succeed at high level), strength and power are fundamental - thus training and monitoring these keys variables are of importance.
I won't go into detail on the methods to assess force-velocity profile in athlete. I would do it most likely worse than JB Morin et al. explain it. So, for more information about it, you can check here [21]. Quickly, to analyze force-velocity profile, practitioners need to use a radar gun or timing gates (or an iphone but the setup is long as well!), get their players sprint for 30-40m to sprint one after the other one and then, compute all the data in spreadsheets or apps. In high-performance context - more specifically football - when time to train is scarce and time to test is close to nothing - practitioners can rarely afford for a 90' testing procedure with a subsequent 60-90' of data analysis.
The use of GPS can solve this problem. We recently demonstrated that GPS were reliable enough to compute force-velocity profile [22] and developed a small code to ease the post-analysis process [23]. Using GPS, you can setup a test within session, asking your players to run from 0-30m with maximal acceleration all at the same time. The good point is that you will likely have a better player buy-in (no testing - it is training, more efficiency, player can compete against each other) and coach-buy (you are not anymore the guy asking for testing time, reducing the actual amount of time to train football). Right after the session, you can split your sprints, export the data and run the calculation in less than 15 min – automatically (Figure 6).

Yet, while vital to success, elite sport is not a place where psychological safety is common [24]. So, I can understand that planning full speed training - worse, testing - is hard for practitioners. So, the question is now - can we go even further and do these evaluations without testing? That's what JB Morin et al. are thinking and what they have recently presented in JB’s blog [25]
"if the single test profile is the result of maximal acceleration intent at each possible running speed, maybe we can “reconstruct” this individual spectrum by collecting enough acceleration and speed GPS data to get, for each running speed reached, the corresponding maximal acceleration produced. Et voilà."
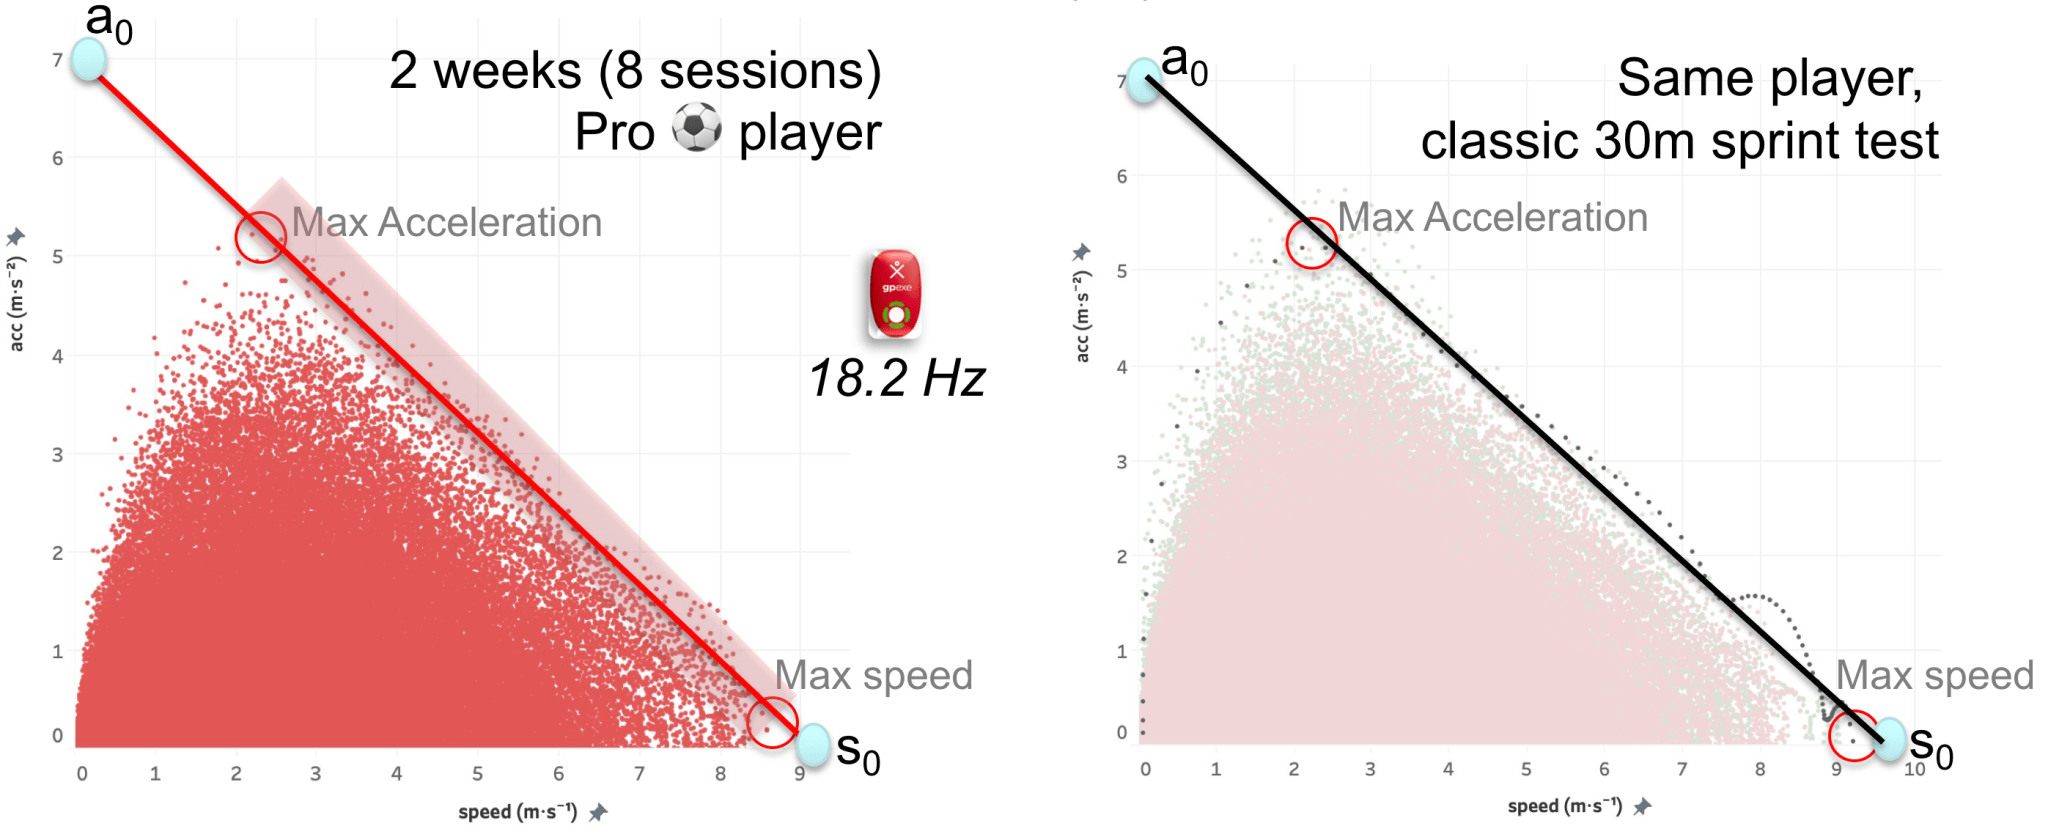
In the Figure 6, Morin et al. computed the linear trend from the 2 maximal acceleration points collected for every 0.2 m/s increment from 3 m/s to the player’s maximal running speed. So, a total of 40-70 data points depending on players’ capability.
From this, we can now use all training data points to compute over time force-velocity profiles. We don't even ask the players to run maximally for a sprint evaluation as mentioned before. They play football, we grab the data and analyze the outputs. The major point that we will have to take into account is that football players rarely reach >95% of their top speed. We recently showed that the occurrence of near-to-maximal speed-running bouts is low in elite soccer. Players did not reach >90% of MSS at all in 35% (Forwards) to 65% (Midfielders) of their matches [26]. But as the relation between speed and acceleration is linear, it looks like that the collection of good data in the range 30-90% of max speed would allow practitioners to infer on F0 and V0 accurately. I can’t wait to see new papers in this area to be published and try to see the practical application with elite athletes.
CONCLUSION
One day, Martin Buchheit claimed that the sports science community was in orbit, and mostly disconnected from the reality of elite performance [27]; while extreme but meaning well as always from Martin, his thoughts are still ringing the bell.
How can we land the Apollo 13 rocket (or, now, the Space X one!) and try to conduct research that could have a bigger impact on the field? While easier said than done, I strongly believe that the topic of "invisible monitoring" or, said differently, the development of insights into athletes’ responses to training derived from the use of microtechnology will be one of the most impactful area of research during the next seasons. Perhaps I’m wrong, but with more congested fixtures every season, smaller pre-season and more pressure on staff and players, I think our role, as sports scientist, will be to find way to help staff to spend more time coaching by reducing testing & analysis burden while providing more insights to help them adapt their training. It is a hard task. But science is not easy.
Special thanks to Cedric Leduc & Ben Simpson for accepting to provide feedbacks on this post.
References
https://pubmed.ncbi.nlm.nih.gov/?term=external+load+sport&sort=date
Kruse K. The 80/20 rule and how it change your life. Forbes. 2016. Available here : https://www.forbes.com/sites/kevinkruse/2016/03/07/80-20-rule/#4322c1ec3814
Cummins C, Orr R, O'Connor H, West C. Global positioning systems (GPS) and microtechnology sensors in team sports: a systematic review. Sports Med 2013; 43:1025-1042.
Halson SL. Monitoring training load to understand fatigue in athletes. Sports Med 2014; 44 (Suppl 2):S139-147.
Drew MK, Finch CF. The relationship between training load and injury, illness and soreness: a systematic and literature review. Sports Med 2016; 46:861-883.
Aughey RJ. Applications of GPS technologies to field sports. Int J Sports Physiol Perform 2011; 6:295-310.
Akenhead R, Nassis GP. Training load and player monitoring in high-level football: current practice and perceptions. Int J Sports Physiol Perform 2016; 11:587-593.
Impellizzeri FM, Marcora SM, Coutts AJ. Internal and External Training Load: 15 Years On. Int J Sports Physiol Perform. 2019;14(2):270-273. doi:10.1123/ijspp.2018-0935
Carling C, Lacome M, McCall A, et al. Monitoring of Post-match Fatigue in Professional Soccer: Welcome to the Real World. Sports Med. 2018;48(12):2695-2702. doi:10.1007/s40279-018-0935-z
Sands WA, Kavanaugh AA, Murray SR, McNeal JR, Jemni M. Modern Techniques and Technologies Applied to Training and Performance Monitoring. Int J Sports Physiol Perform. 2017;12(Suppl 2):S263-S272. doi:10.1123/ijspp.2016-0405
Lacome M, Simpson B, Broad N, Buchheit M. Monitoring Players' Readiness Using Predicted Heart-Rate Responses to Soccer Drills. Int J Sports Physiol Perform. 2018;13(10):1273-1280. doi:10.1123/ijspp.2018-0026
Buchheit M., Simpson B., Lacome M. Monitoring cardiorespiratory fitness in professional soccer players: is it xorth the prick? Int J Sports Physiol Perform 2020 [ahead of print] Available here: https://martin-buchheit.net/2020/02/02/monitoring-cardiorespiratory-fitness-in-professional-soccer-players-is-it-worth-the-prick/
Ramírez-López C, Till K, Boyd A, et al. Coopetition: cooperation among competitors to enhance applied research and drive innovation in elite sport [published online ahead of print, 2020 Aug 3]. Br J Sports Med. 2020;bjsports-2020-102901. doi:10.1136/bjsports-2020-102901
Girard O, Micallef JP, Millet GP. Changes in spring-mass model characteristics during repeated running sprints. Eur J Appl Physiol. 2011;111(1):125{34.
Barrett S, Midgley A, Reeves M, Joel T, Franklin E, Heyworth R, et al. The within-match patterns of locomotor efficiency during professional soccer match play: Implications for injury risk? J Sci Med Sport. 2016;19(10):810{5. Leduc C., Lacome M., Buchheit M.
Leduc C., Buchheit M., Lacome M. The use of standardised runs (and associated data analysis) to monitor neuromuscular status in team sports players: a call to action. Sports Performance and Science Reports. Aug 2020,117
Leduc, C, Tee, J, Lacome, M, Weakley, J, Cheradame, J, Ramirez, C, Jones B. Convergent validity, reliability and sensitivity of a running test to monitor neuromuscular fatigue. Int J Sport Physiol Perform. 2020;in press.
Buchheit M, Lacome M, Cholley Y, Simpson BM. Neuromuscular responses to conditioned soccer sessions assessed via GPS-Embedded accelerometers: Insights into tactical periodization. Int J Sports Physiol Perform. 2018;13(5):577{83.
Buchheit M, Cholley Y, Lambert P. Psychometric and physiological responses to a preseason competitive camp in the heat with a 6-hour time difference in elite soccer players. Int J Sports Physiol Perform. 2016;11(2):176{81.
Jaskowak DJ, Williams JH, Tegarden DP. Use of a GPS- Embedded Accelerometer to Evaluate the Complexity of the Running Gait . Part 2: Effects of Fatiguing Activity. Sport Perform Sci Reports. 2019;1{3.
Romero-Franco N, Jiménez-Reyes P, Castaño-Zambudio A, et al. Sprint performance and mechanical outputs computed with an iPhone app: Comparison with existing reference methods. Eur J Sport Sci. 2017;17(4):386-392. doi:10.1080/17461391.2016.1249031
Lacome M., Ower C., Peeters A., Piscione J., LeMeur Y., Leduc C. Force velocity profiling with GPS: is it reliable? Sport Perform Sci Reports. 2020;.
Lacome M. Calculating Force-velocity profile assess through GPS devices in Soccer: From labouring to automatic process, Available here: http://mathlacome.com/fvp-easy/
Delizonna L. High-Performing Teams Need Psychological Safety. Here’s How to Create It. Harvard business review. 2017. Available here: https://hbr.org/2017/08/high-performing-teams-need-psychological-safety-heres-how-to-create-it.
Morin JB., Le Mat Y., Osgnach C., Di Prampero P.E and Samozino P. The “in-situ” sprint profile for team sports: testing players without testing them? Available here: https://jbmorin.net/2020/08/02/the-in-situ-sprint-profile-for-team-sports-testing-players-without-testing-them/
Buchheit M., Simpson B., Hader K. and Lacome M. Occurrences of near-to-maximal speed running bouts in elite soccer: insights for training prescription and injury mitigation. Science and Medicine in Football 2020 [ahead of print]
Buchheit M. Houston, We Still Have a Problem. Int J Sports Physiol Perform. 2017;12(8):1111-1114. doi:10.1123/ijspp.2017-0422
Lacome M., Simpson B., and Buchheit M. Monitoring training status with player-tracking technology. Aspetar Journal. 2020. Available here : https://www.aspetar.com/journal/viewarticle.aspx?id=407#.XzPv5RMzZhE
[/et_pb_text][/et_pb_column][/et_pb_row][/et_pb_section]