Calculating Force-velocity profile assess through GPS devices in Soccer: From labouring to automatic process

Background
Before delving into some sport science, it is important to explain how this project started. Early in March, when the world started to be in lockdown, we developed a platform aiming to connect young research named HelpMyResearch. With that in mind, I decided to make a collaboration about the present blog. This has been set up super quickly and I teamed up with 3 promising PhD students keen to help me out. A few weeks later, we ended up with a first draft of analysis! Imagine doing so using the usual pathway (going to conference, meet with people, send email, having agreement on what to do and so on...)? Here, HelpMyResearch enables you to speed up the whole collaboration process and showed some promise for the future.
Introduction
Modern soccer is becoming stronger and faster. Those assumptions are further strengthened by the clear impact of those high intensity movements (sprint, acceleration, jump) on match outcomes (Faude et al., 2012). Additionally, a 50% increase in sprint distance over the last 20 years has been observed and it is yet to be finished (Nassis et al., 2020). Consequently, it is important for practitioners to ensure that those qualities are well trained and monitored. Recently force-velocity profile has been developed in order to assess accurately the ability of a player to produce horizontal force (Morin et al., 2016).
In order to calculate this profile, practitioners are required to use several devices such as radar gun or timing gates and compute those data into a specific spreadsheet. However, in the context of elite sport environment, time is scarce and it may be difficult for practitioners to allocate specific sessions in their schedule to assess force-velocity profile either during pre or in season cycle. Indeed, this approach requires approximatively 90 min to test 25 players and an equivalent time to process and analyse the data.
One solution to alleviate the above-mentioned limits could be to use micro technologies such as GPS devices. Indeed, those sensors are becoming more and more accurate due to the inclusion of double constellation system. Additionally, the use of advanced computer technique would allow practitioners to make the whole data processing step automatic and save the time they do not have to monitor these physical qualities in season.
Therefore, the aim of the current blog post is to detail our automatic process in order to obtain force-velocity profile-related information. A reliability study is coming in the coming weeks - so, stay tuned.
Our method: A step by step approach
To ease the process, we have built with Cameron Owen and Cedric Leduc a short code allowing the following things:
Split the GPS files based on the numbers of sprints performed.
Trim the data to only consider what you need for analysis (i.e. sprint start, first point after 0.3 m.s-1 as recommended by the Professor Jean Benoit Morin)
Run the model using Mladen Jovanovic's function initially used for Radar files.
Calculate the key parameters and build a report.
Please note that the code is available for Statsport GPS files only right now.
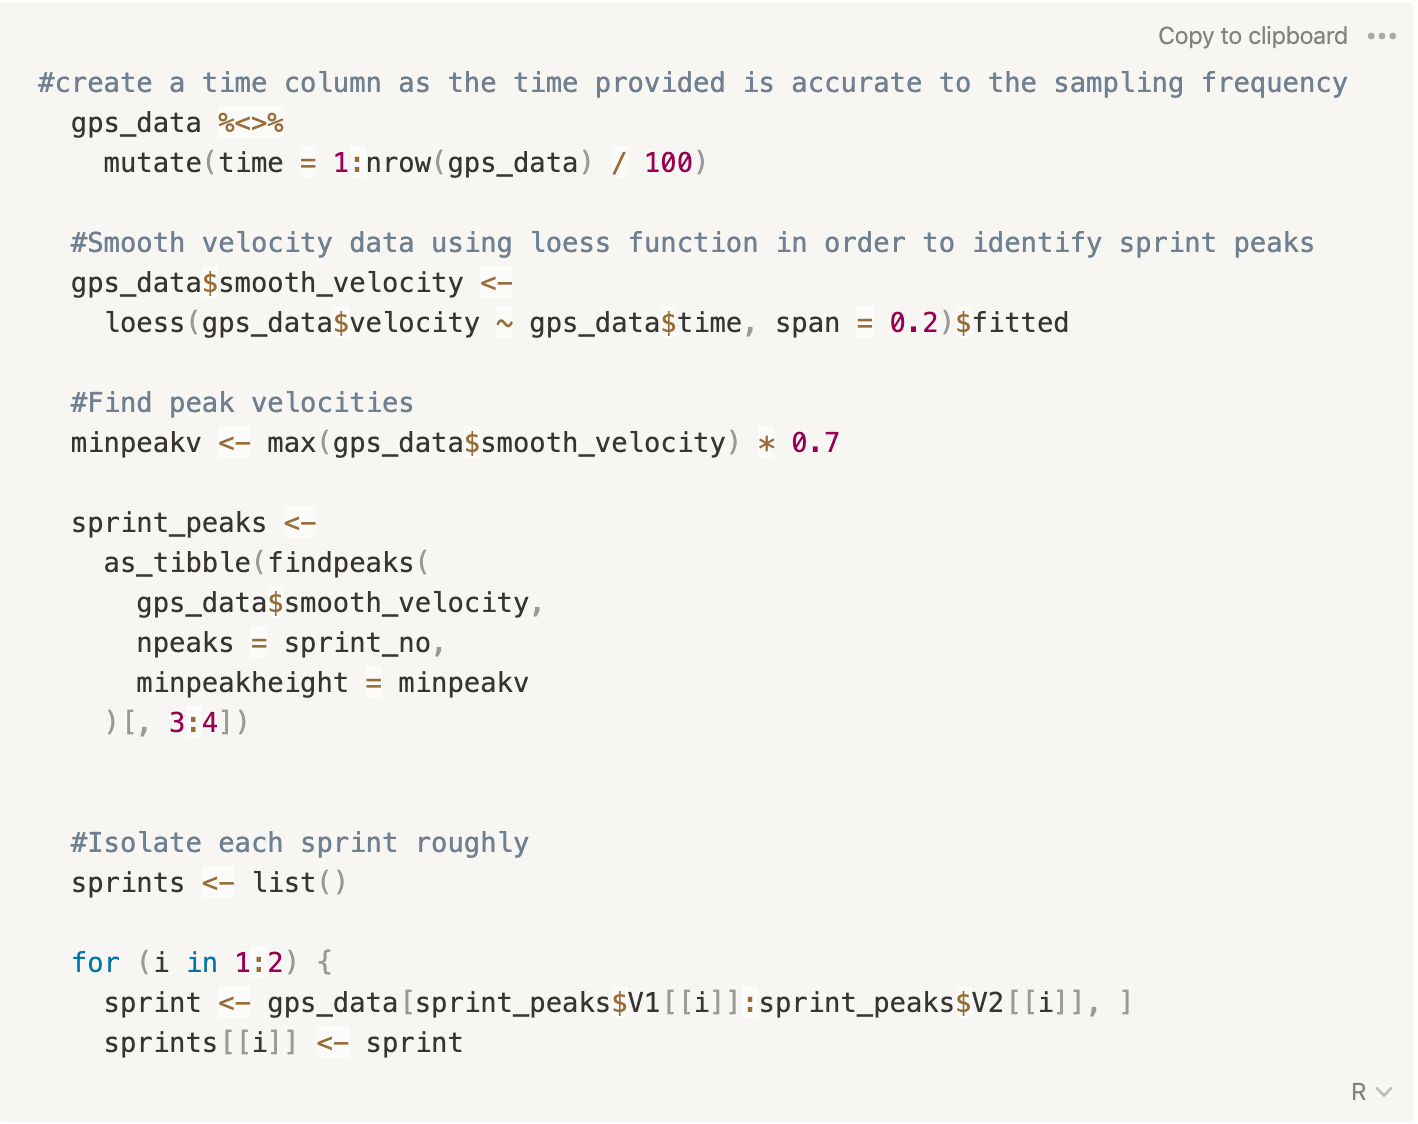
Players performed multiple sprints (here 2) so the first step was to cut this file in 2 separate ones.
First thing first, we import the data. Note that in the full version of the code, you can import batch of files, meaning you can analyse hundreds of files in a row.

For each GPS file, we had 2 sprints - again, in the final version of the function, you can define the number of sprints you did (1 to n) and the function will separate each sprint into different list of data:

Once we isolate each sprint, it is time to trim the data to keep only the useful ones for analysis, as the modeling function only needs the velocity from the beginning of the sprint to the plateau phase.

Note that the trimming could be done based on accelerometer data, permitting the identification of the first step. Cameron can help you on this one!

The following step is to model these data using Jovanovic's function and then, calculate key parameters.
The new function take as entry a dataset (data here), the sprint number and do the trick.
The first part of the new function is just looping over the files and sprints to recreate a proper dataset.
Note that we fixed the bodyweight to 75 kg here, but if the files are labelled named_bw or that you have a list of players with their bodyweight, this can easily be automatized.

Once we have modeled the data, we can use the new variables (e.g. Tau, time delay, MSS...) to re-create all key variables to fully understand the force-velocity profile of our players:

Finally, the function has some other nice feature:
creating a full report per file and per sprint.
creating a complete dataset with the modelled data so you can play around.
merging all key variables into 1 file so you can jump on your players' comparison and preparing the training plan (the fun part to be honest...).
Conclusion
Now, based on the proposed method, the whole process is drastically fastened and allows the assessment of a full squad in 15 min (10 for the sprint assessment, 5 for analysis !). In the coming next weeks (or days if we are efficient), we will release a post to assess the reliability of the force-velocity profile using GPS - likely opening new possibilities for practitioners who want to implement force-velocity profile on the field but are looking for time or GPS-related solutions.

Resources
The following work has been made with some existing function developed by Mladen Jovanovic and the spreadsheet developed by the professor Jean Benoit Morin.
If you want to implement this approach into your practice, please follow this link and get a free the code used: